A Detailed Pedestrian Comfort Wind Microclimate Simulation Feasibility Study
As the Xi team counts down the days until Christmas, concern was raised at our weekly meeting. “Will Santa Claus be able to visit Xi’s office in Edinburgh?”
But why would Father Christmas miss a present delivery at Xi? Despite being known as “Auld Reekie”, Edinburgh, once filled with smoke spewing chimney stacks, is no longer very reekie. Indeed, Xi’s office in Codebase doesn’t even have a chimney, but that’s ok as Santa can shimmy down the building’s lift shaft instead.
It might not be smoky anymore, but Edinburgh is still windy. Also known as “The Windy City” (long before Chicago was), locals know not to carry an umbrella as it won’t last long. Wind channelled by the ancient narrow streets and of course the imposing Edinburgh Castle will quickly turn a brolly inside out!
Xi’s office is right next door to Edinburgh Castle, downwind from the northerly wind from Lapland that will bring Santa on his sleigh, and here lies the concern. Will it be safe for Santa to land his sleigh on the roof, or does he risk being blown over the edge? Will Elf and Safety cancel Xi’s Christmas?
How does Santa Do it? How fast and far will Santa need to go?
Every year, on the 24th of December, children (and engineers) around the world await the presents Santa Claus has brought for them to open on Christmas day. To put into context how hard Santa must work to ensure we all have a Merry Christmas, here are some numbers about his annual Christmas journey: To deliver all our Christmas presents in time, Santa Claus must travel approximately 160,000,000 km (further than the distance between the Earth and the Sun) and visit ~800,000,000 homes to deliver presents for 8,000,000,000 people across the world in the space of 10 hours. Sounds impossible, right? Not so – thanks to the differing time zones across the world. Using Earth’s rotation and some clever scheduling Santa can add 24 hours to his delivery time, giving him 34 hours to deliver our presents. Even so, this means he must travel at speeds of approximately 4,710,000 km/h between each household which, whilst being significantly less than the speed of light in air (roughly 11,000,000,000 km/h), is still an incredibly fast speed to travel at. But don’t worry, he has done this for thousands of years, and it is second nature to him, so much so he could probably do this journey with a blind fold, albeit we would strongly advise against it!
Wait, but could the weather stop Santa from visiting Edinburgh?
So, we can relax knowing that Santa will work incredibly hard once again this year to deliver our Christmas presents…or can we? Because, let’s face it, the weather, and the associated wind conditions in the United Kingdom (especially Scotland) during the winter months are often far from ideal for safe travelling by flying reindeer sleigh. So, have you ever stopped and wondered how Santa can safely travel with such adverse weather conditions, park his sleigh on our roofs with his eight trusted reindeers (Dasher, Prancer, Vixen, Comet, Cupid, Donner, Blitzen, and Rudolph) without getting blown over so that he can make his way down our chimneys (lift shaft) and deliver our presents?
To demonstrate the importance of the weather and wind conditions during Santa’s journey, we created a wind microclimate study of the city of Edinburgh, focusing on the wind speed conditions on the roof of the CodeBase Building in Lady Lawson Street, where the office of Xi Engineering Consultants (Xi) is based. Similar studies are used by our engineering team to aid property developers in the process of the development of new buildings and advise what mitigations can help fight against potential adverse wind conditions.
The modelling process used to consider Santa’s safe landing options
The process of building a working model for a wind microclimate study requires three main components:
- A geometric, 3D model of the proposed development and surrounding area, built and meshed to provide a good representation for the wind flow around the buildings and terrain), additional models may also be needed, representing future and cumulative developments in the area.
- An accumulation of historic wind data for the site, acquired from local weather stations.
- The planned use cases for the site before and following the construction or development.
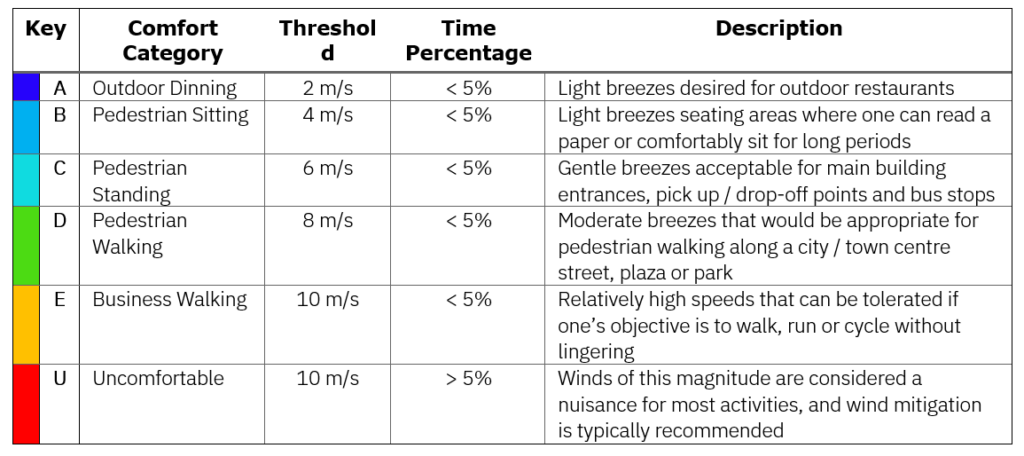
The choice of software adopted by Xi for any wind microclimate study has always been SimScale, which is a computer aided engineering (CAE) software package that allows engineers to solve complicated problems, not just in wind, but in other areas as well (e.g., Fluid Dynamics, Heat Transfer, and Solid Mechanics). SimScale has an in-built module designed to investigate the effects of the aerodynamics of buildings on pedestrian comfort and safety, namely, the Pedestrian Wind Comfort (PWC) module which utilises the Lattice Boltzmann method for efficient evaluation of wind conditions in large domains. This enables engineers to advise developers working on a new development whether it will have an impact on pedestrian activity (e.g., standing, sitting, walking), and if mitigations, such as screens, are required to ensure pedestrian safety is prevailed. The model runs by solving a complicated set of equations numerically, which will output the wind speeds over the region of interest. The results are justified physically by comparing the results of simulations to internationally recognized criteria, such as Lawson criterion, which define pedestrian comfort and safety levels according to intervals of wind speed. For this blogpost, we will concentrate on using the Lawson LDDC Comfort Criteria to justify the results (see Table 1).
Understanding the local Conditions: Edinburgh Castle Simulation Model
A 3D model of the city of Edinburgh was built by Xi using the software package SketchUp, along with a variety of online sources to measure the heights of different building types and define what type of buildings they are. The model was adapted to include porous objects like trees which fill the neighbouring parks and can have a significant impact on wind behaviour. By specifying the appropriate number of wind directions over which the model is solved and using the in-built wind data for Edinburgh, which is recorded in SimScale; the model is solved and the results are then processed. All of the models considered here showed the prevailing winds come from the south-west direction.
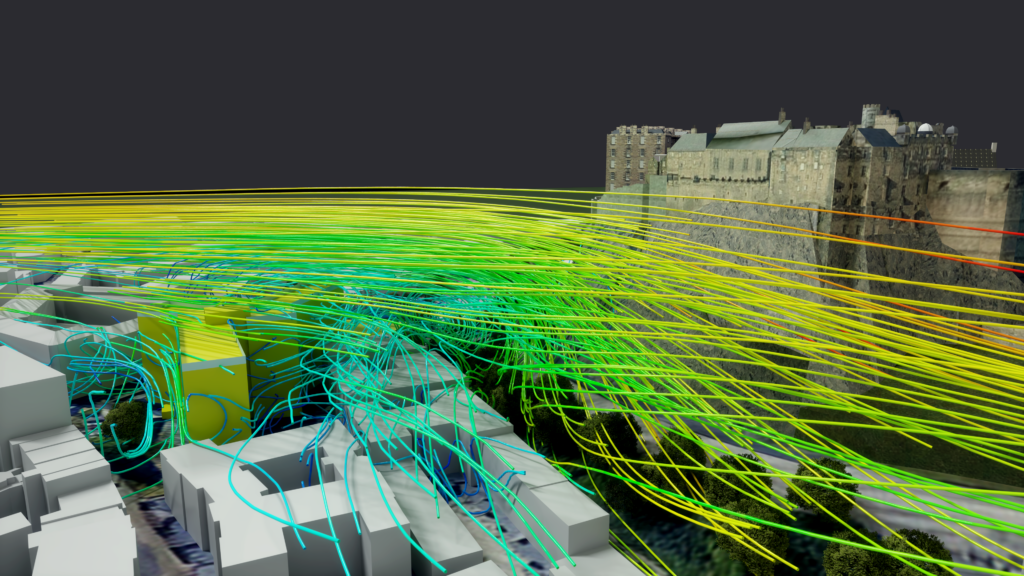
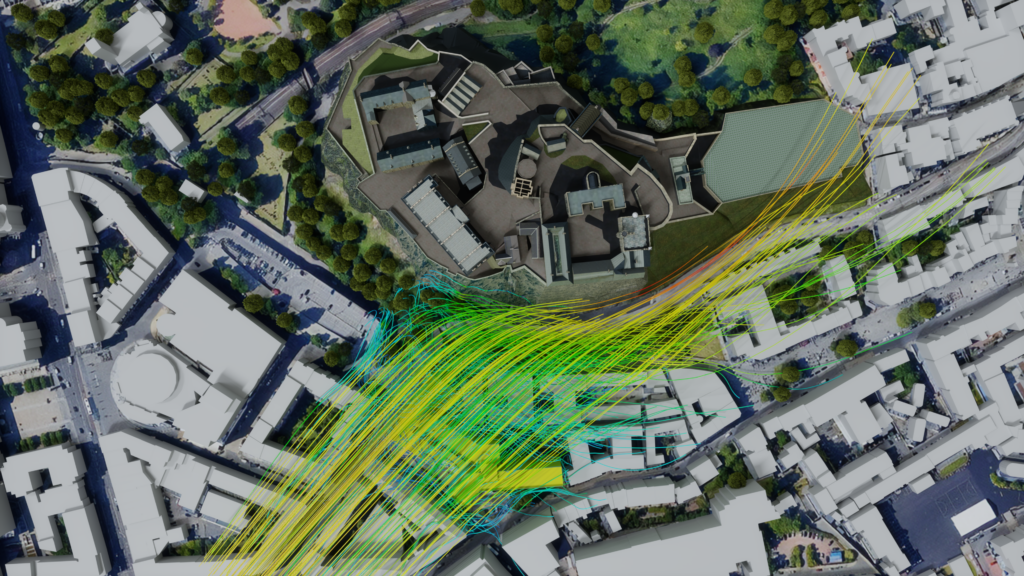
Figure 1 – Wind streamlines over Xi’s office in yellow. (Visualized in NVIDIA Omniverse)
Is it Safe for Santa?: Lawson LLDC Criteria around Codebase Building
The wind comfort conditions on the roof of the CodeBase Building are shown in Figure 2 which, according to the Lawson LLDC Criteria show areas which are predominately suitable for Pedestrian Walking and Business Walking, with very small regions of Uncomfortable wind speeds occurring close to the boundaries of the rooftop. This is explored further in Figure 3, where the wind conditions are shown across around the CodeBase Building and the castle. The large volcanic plug on which Edinburgh Castle sits has a significant impact on the local wind conditions. It blocks the flow of air, channelling the wind around and over it, accelerating the wind as it does so; this gives rise to uncomfortable wind conditions surrounding and close to the cliff faces. These high winds surrounding Edinburgh Castle are unavoidable, but as has been shown, also has an impact on surrounding buildings. These results suggest that some mitigations would be beneficial to make Santa’s landing safer. It is a standard procedure in Wind Microclimate studies to include mitigations to reduce the effects of adverse wind conditions.
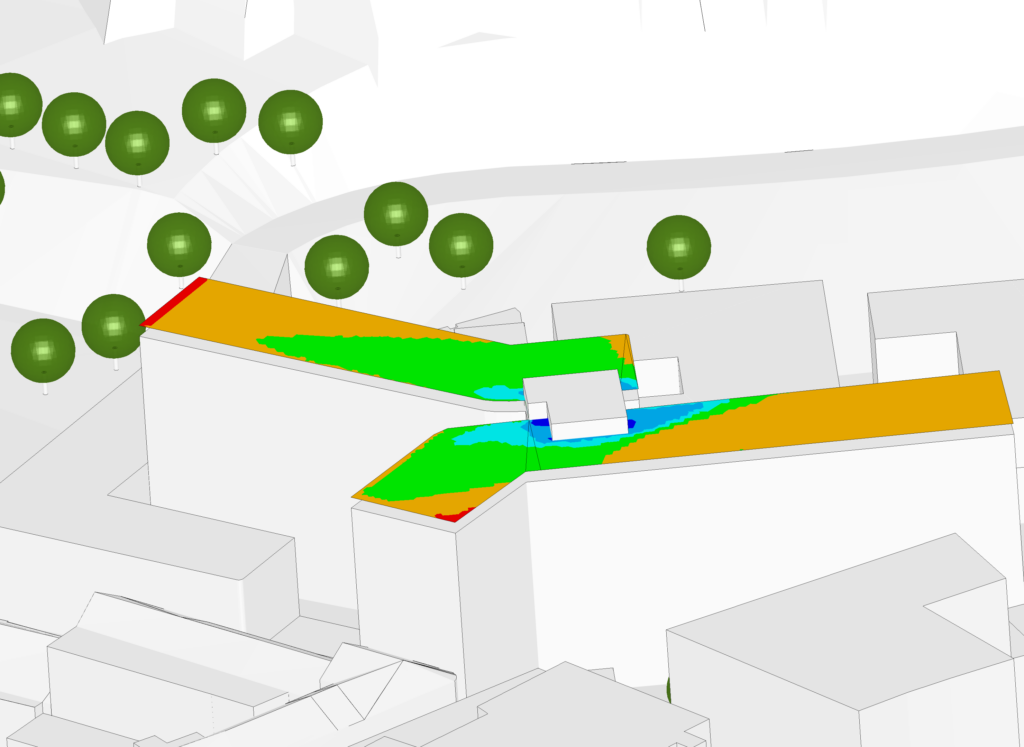
Figure 2 – Results for the wind speeds using the Lawson LDDC Criteria when the roof of the CodeBase Building is not surrounded by railings.
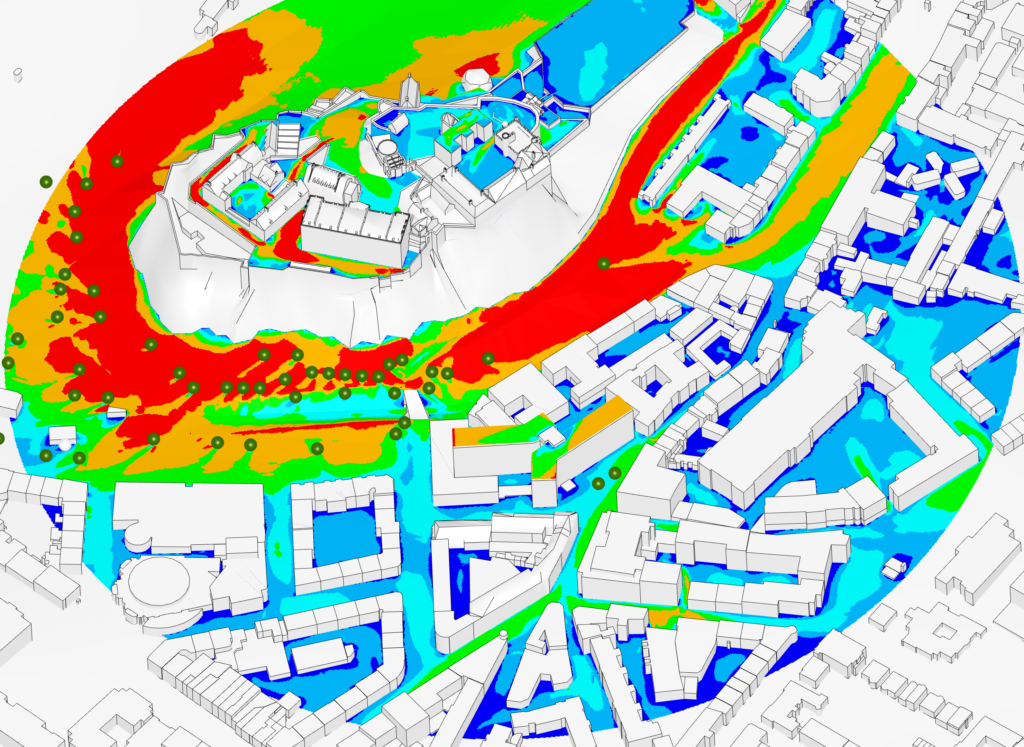
Figure 3 – Results for the wind speed using the Lawson LLDC Criteria across the region of interest in the city of Edinburgh when the roof of the CodeBase Building is not surrounded by railings.
Mitigations to make Santa’s landing safer
To improve the conditions for Santa landing on the roof of Xi’s office, Xi wanted to test mitigation in the form of wind screens around the edge of the roof, and compare the wind criteria before and after.
The same model will now be considered, but with the inclusion of wind screens around the edge of the building roof in the hope that these railings will reduce the areas of higher wind conditions observed in Figure 2, and therefore make it safer for Santa to land. To validate the effects of the mitigations, we will compare the results of the models with and without the railings on the roof. Figure 4 shows the rooftop results now including wind screens. As can be seen in Figure 4, with wind screens, there are now no areas of wind speeds higher than 8m/s for a prolonged period of time, with most of the roof suitable for Santa to land his sleigh safely with his reindeer and take a quick break before continuing on his deliveries. Figure 5 shows the streamlines over Xi’s office and past the castle. Rudolph will need to be careful when he takes off!
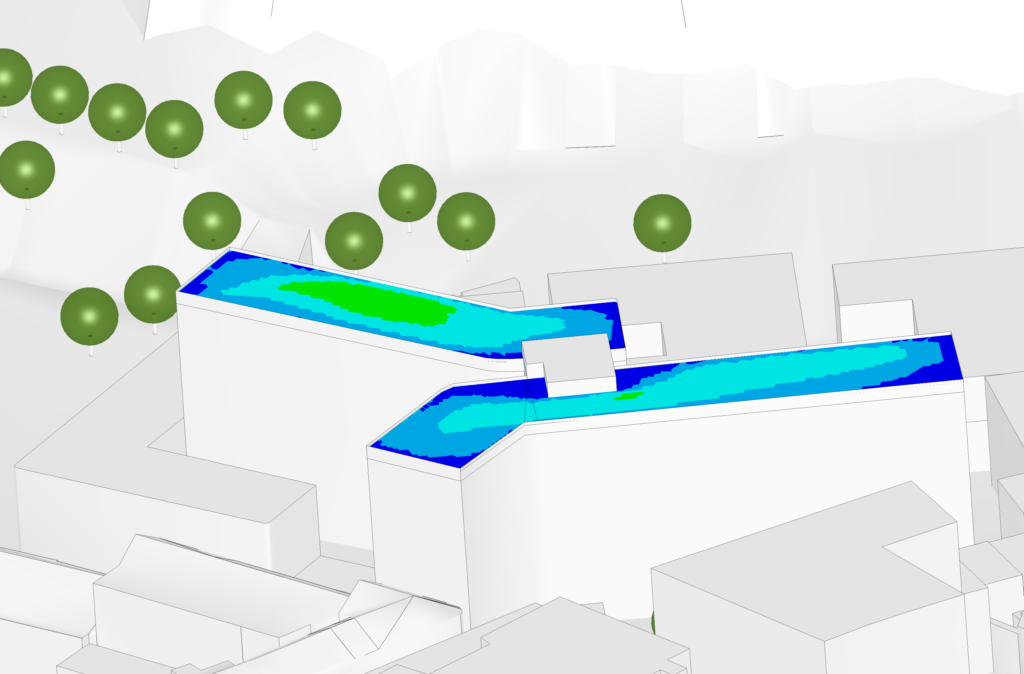
Figure 4 – Results for the wind speeds using the Lawson LDDC Criteria when the roof of the CodeBase Building is surrounded by railings.
Visualizing the dynamic nature of the wind
The high winds surrounding Edinburgh Castle visible in the results in Figure 3 and Figure 5 remain a characteristic of the surrounding terrain and the castle rock. Characteristics such as these are critical for consideration in designing how a space can be used comfortably and safely. Santa is of course used to navigating these high winds, Edinburgh’s Castle rock has been around for even longer than Santa, however, Xi’s offices haven’t been around quite as long and we want to make Santa’s landing as comfortable as possible. In helping to design mitigation it can be helpful to understand how the wind flows through a development, or in our case over the roof. Figure 7 shows the flow of wind using contour lines. It can be seen how the inclusion of wind screen mitigation disrupts and slows the wind over the surface of the roof. The streamlines also show that the wind speed reduces as a result of the screening, verifying that the inclusion of mitigations has achieved their desired effect.
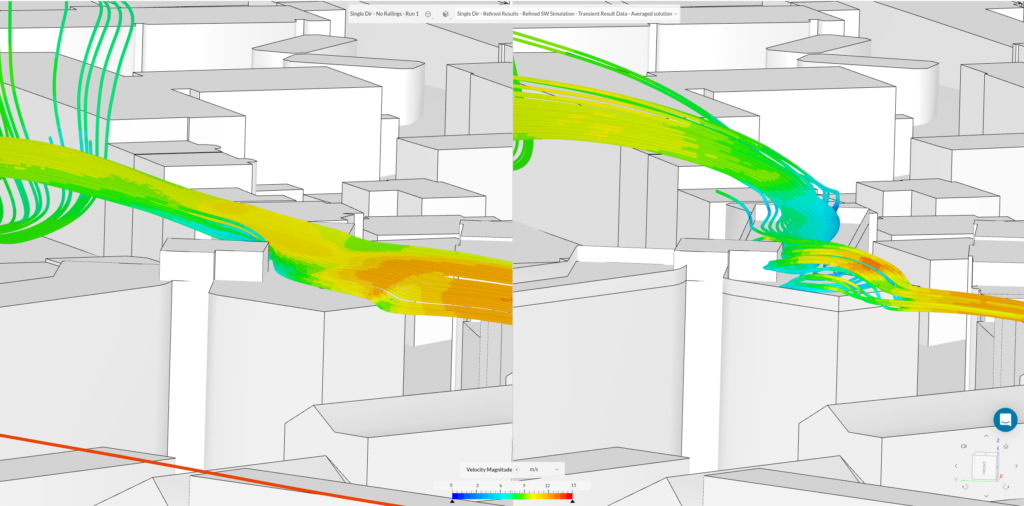
Figure 7 – Comparison of the CodeBase Building wind speeds on the roof without railings (left) and with railings (right) using contour lines. These pictures show a bird’s eye view of the wind speed patterns.
Visualizing the dynamic nature of the wind can also be very helpful in understanding the wind to inform mitigation design. SimScale wind simulations not only consider steady state conditions but also the dynamic turbulent nature of wind. We can see a 3D picture of how the wind propagates across the region close to the CodeBase Building in Figure 8. This picture was created in NVIDIA Omniverse using the SimScale Connector for Omniverse. Omniverse is a real-time 3D collaboration and simulation platform that enables design teams to unite disparate, full-fidelity data sources and large-scale simulation models into a single unified, interactive view. We can see a full 3D animation of how the wind propagates across the full region of interest in Figure 9.
So, will Santa come to Codebase this year?
Will Santa be able to deliver Xi’s Christmas presents? Let’s be honest, probably, if there’s one person who knows how to negotiate an icy roof top it’s Santa Claus. But, looking ahead to Edinburgh’s one day of summer. Could the office roof make a nice place to sit to eat lunch and take in the view? Yes with some careful wind screen placement informed by wind microclimate modelling.
The big risk for the Xi’s team and receiving Christmas presents is not the wind, it’s whether we are on the nice list! Perhaps lumps of coal for all and a return to Auld Reekie!
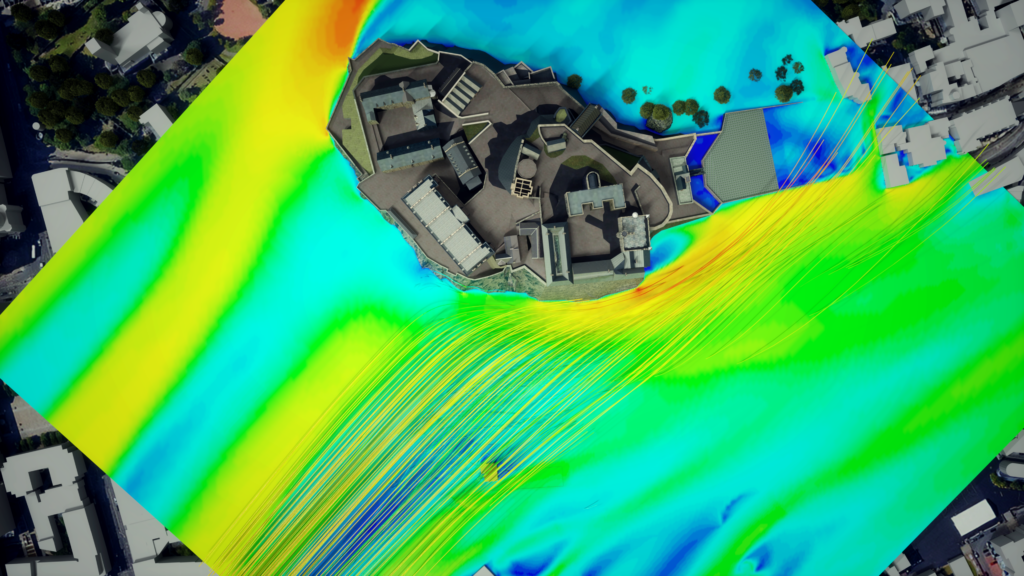
Figure 8 – Picture of how the wind propagates close to the CodeBase Building. (Visualized in NVIDIA Omniverse)
Figure 9 – Animation of how the wind propagates around the region of interest when railings are included on the roof using the Lawson LLDC Criteria. (SimScale Animation)