Offshore Wind Farms as a Growing Source of Renewable Energy
Offshore wind development continues to grow, providing an important source of renewable energy, with global capacity expected to be as high as 4.3 GW by 2030. While offshore wind farms come with large capital expenses, they are located in ideal environments where nearly continuous wind is available to drive steady power generation. Indeed, a large fraction of global floating offshore capacity is installed in the UK, especially in Scottish waters where optimal North Atlantic and North Sea wind conditions are present.
Individual offshore turbines are typically larger than their land-based counterparts and thus yield higher power production rates. An optimal wind environment, combined with the higher power generation rate, are driving factors behind the interest in promoting offshore wind as a key component in the ongoing renewable energy transition.
Underwater Noise from Offshore Wind Farms
As floating offshore wind development expands with the deployment of larger turbines, larger numbers of turbines per farm, and placement in deeper waters, gaining a better understanding of the local underwater sound environment takes on greater importance.
A few types of fixed and floating offshore platforms are used in the majority of deployed systems. These include fixed types such as Driven Monopile and Steel Jacket Tower, and floating types such as Tension Leg, Spar Buoy and Semi-Submersible. The optimal choice for any particular site depends on factors such as seabed depth, seabed morphology/geology, power generation requirements, expected weather/wave conditions, and available/suitable transmission infrastructure.
Underwater noise caused by the operation (i.e. blade, rotor, gearbox rotation) of floating turbines is expected to be similar to that produced by fixed offshore turbines. This is because the moving parts are located above water in the tower and nacelle. Floating platforms, however, also produce “snap” noises when tension in the mooring lines is released.
The mooring lines anchor the platform to the seabed and allow the floating platform to bob and sway with the waves; thus, the occurrence of mooring line snaps is inherently difficult to predict but is an extremely important component of the local sound environment. The snaps are broadband, meaning they can disturb or even cause injury to a wide range of species, regardless of individual auditory ranges, and they are loud (i.e. 160 dB ref 1 µPa at 150 m).
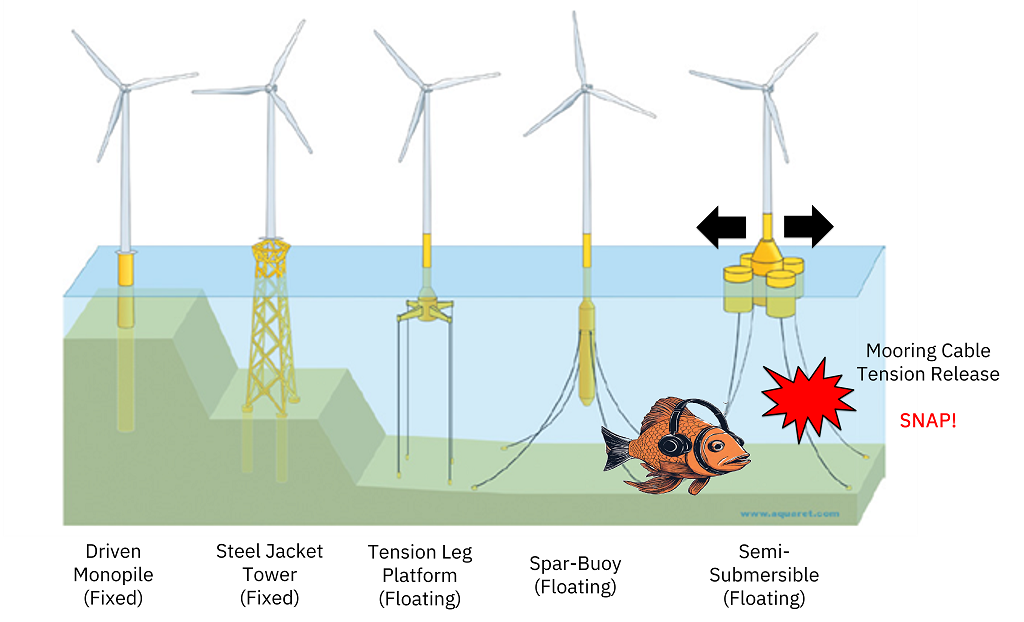
Fig 1: Different types of fixed and floating offshore platforms are deployed depending on factors including depth, seabed geology, expected weather conditions, or power requirements. Mooring lines can release tension in loud, broadband snaps. Image AI generated by the Author using Canva.com.
Recording Underwater Noise at the Kincardine Offshore Wind Farm
Further study of underwater noise environments is required to better understand the impact of existing wind farms on marine life, and to thus support the development of suitable planning requirements for future projects. The underwater noise environment at a wind farm is complex, and is composed of number of different sound sources: wind and wave action, sea life, passing vessels, turbine operational noise (gearbox, rotors, blades), structural noises, mooring line snaps, etc… Because of this complexity, study of these acoustic profiles inherently can benefit from a statistical machine learning approach.
Underwater acoustic data were collected by the Scottish Association for Marine Science (SAMS) as part of the Supergen ORE Hub 2018 Pilot projects, set at two offshore wind farms: Kincardine (Principle Power, semi-submersible platform, 47.5 MW) and Hywind Scotland (Equinor, spar-buoy platform, 30 MW), with five turbines installed at each.
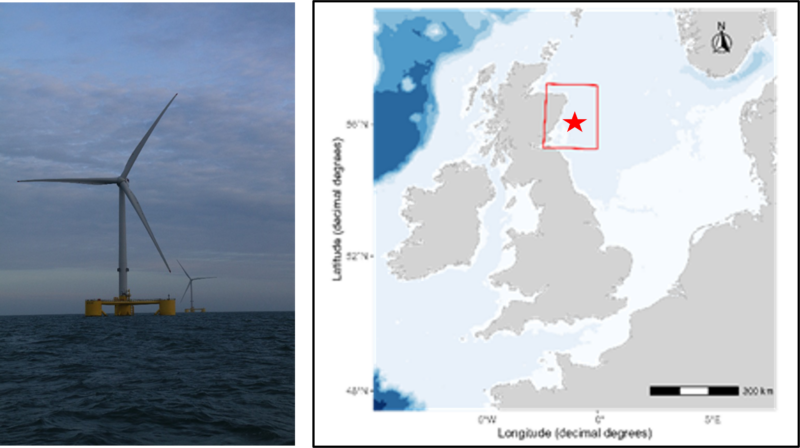
Fig 2: Turbines at the Kincardine Offshore Windfarm, off the east coast of Scotland near Aberdeen.
Classification of Underwater Noise Environment with Machine Learning
SAMS provided Xi Engineering Consultants with audio recordings from a hydrophone located 200 m from a turbine at the Kincardine offshore wind farm off the northeast coast of Scotland. These were accompanied by additional data from the turbines, such as windspeed, blade rotation rate and output power.
A convolutional neural network (CNN) was developed to classify audio signals according to the corresponding local windspeed: 0 m/s (turbine non-operational), 0-5 m/s, 5-10 m/s, and 10-20 m/s. The audio signals were automatically associated with a corresponding windspeed bin, i.e. “tagged”, using timestamps. Additionally, short, broadband mooring line snaps could be manually tagged, with the corresponding timestamp, by using spectrograms of the audio signals. This provided five categories related to turbine noise generation that each audio signal could be classified into.
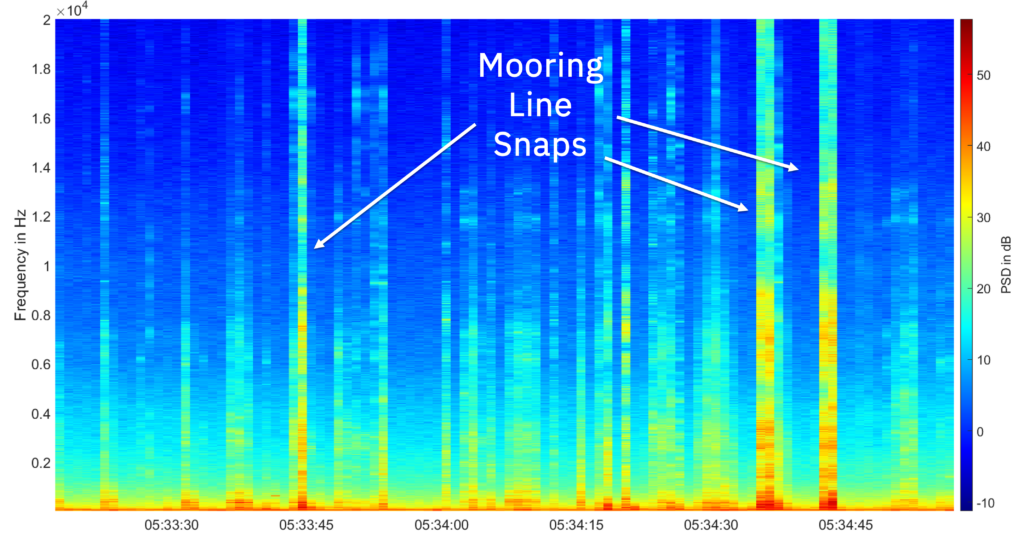
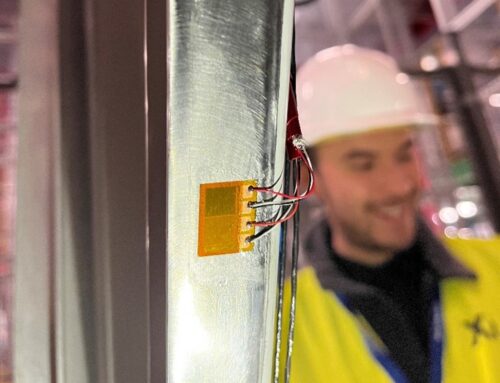
Fig 3: Mooring line snap events were manually identified via spectrograms produced from the audio recordings and added to the neural network training data.
The training was performed by providing training data sets (audio signals + associated class tags) to the neural network. The model learns to associate patterns in each signal with the associated tag. Modern computing power allows the neural network to use statistical techniques to “see” patterns in the signals that human observers would have a hard time identifying. Each additional training signal, plus its tag, helps the CNN continually update itself and improve performance.
The audio signals were pre-processed into a form for computationally efficient neural network training, as shown below:
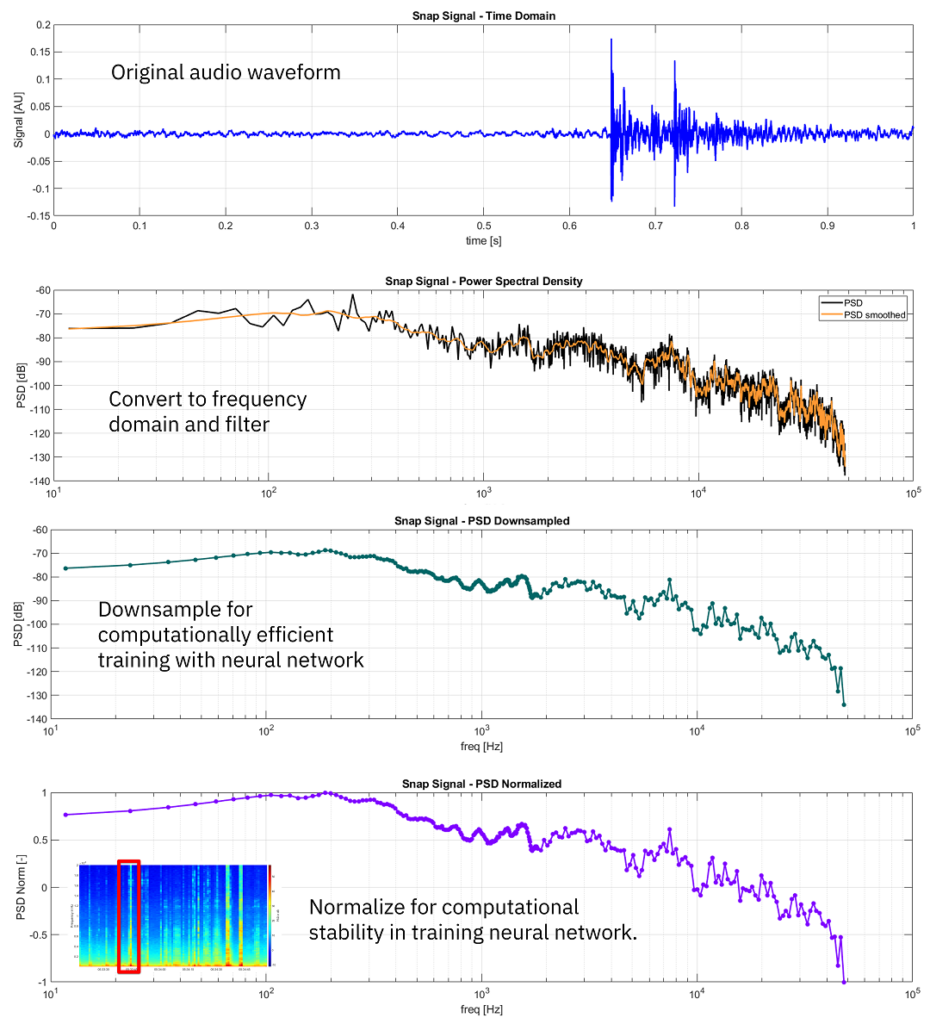
Fig 4: Pre-processing steps used to prepare audio signals for neural network training and testing.
Fig 5: Randomly selected signals from three different categories of audio environment: mooring line snap, windspeed 10-20 m/s, turbine non-operational. Patterns distinguishing these signals are not immediately obvious, lending this type of classification problem to a machine learning approach.
Neural networks usually won’t perform classification perfectly, but with the right type of model trained on the right kinds of data, high accuracy can be achieved. In this work, for example, the model’s class accuracy rates were between 90% and 98% when tagged “test” signals were provided to the model. These test signals were not involved in the training process, and thus the model had never seen them before; this helps to ensure that the model is unbiased.
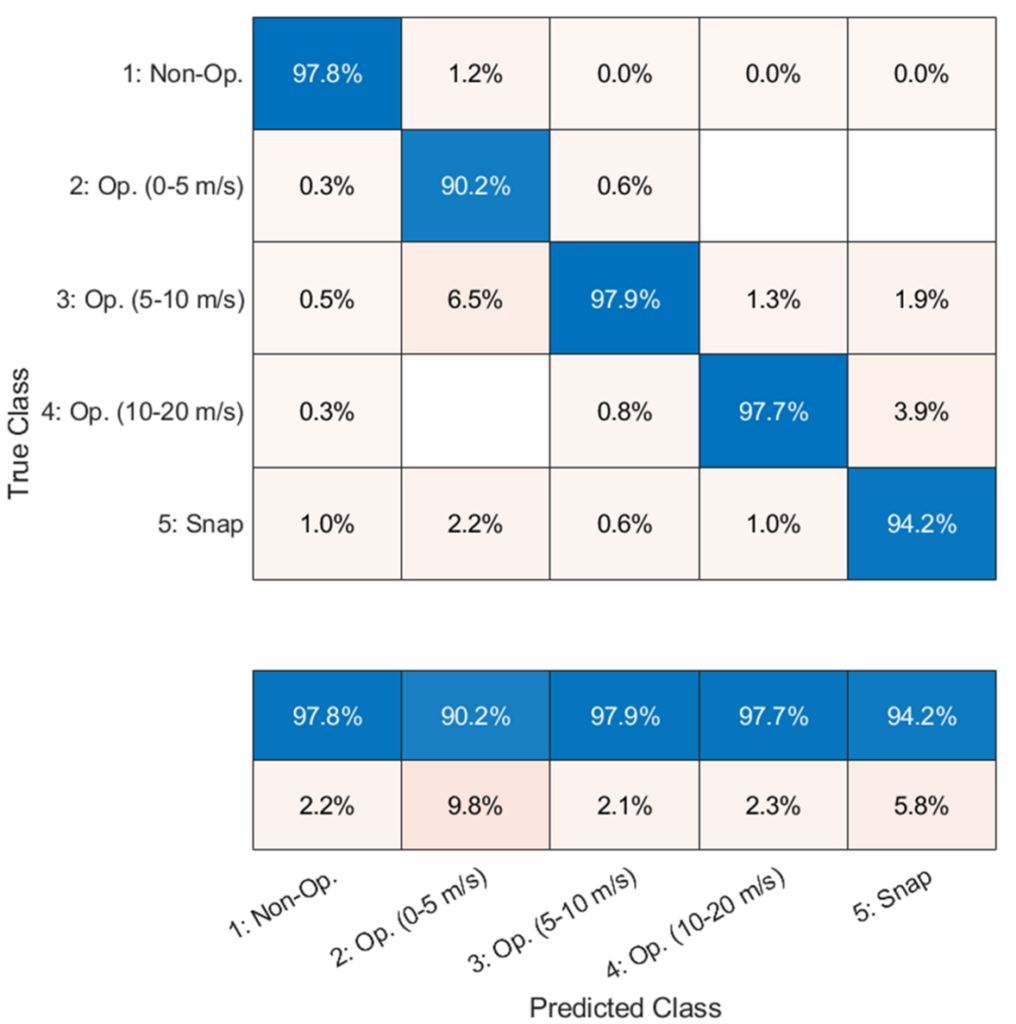
Fig 6: Confusion chart indicating category classification accuracy rate. Such charts are commonly used in machine learning data analysis as they help data analysts improve their models where one category may be confused for another.
Machine Learning & Data Analysis Expertise and Capabilities
Indeed, even beyond simply studying such noise for the benefit of marine life, such an approach can be beneficial for predictive maintenance purposes, such as identifying changes in the sound of a gearbox which has experienced significant wear. Long term, such approaches can lower operational costs, reduce downtime, and extend platform lifetime.
Xi are experts in data analysis and interpretation across a range of engineering disciplines including acoustics and vibrations, structural mechanics and fatigue, electromagnetics, thermal design, batteries, fluid dynamics, and more. If you have a project where you need help using large sets of measured or simulated data, get in touch.